Too Loud, Too Crowded, Still Proud on the Road: The Human Health Impacts of Excessive Noise Exposure in Kenya's Matatus
Shocking findings on how just a 10 minute ride in a noisy matatu results in unseen injuries and damage your health. On International Nose Awareness Day 2026, we deploy citizen science tools to explore how millions of Kenyans are exposed to dangerously loud music in matatus on a daily basis and how this results in long-term negative physical & mental health effects.
Richard Muraya
Author
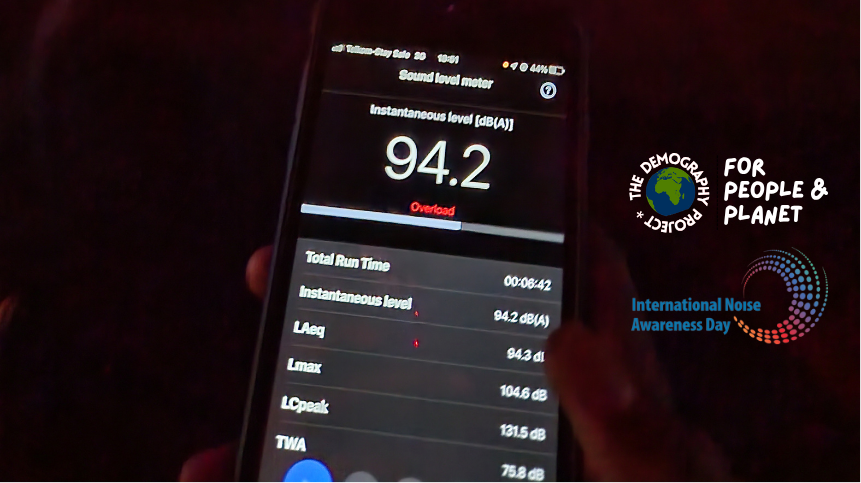
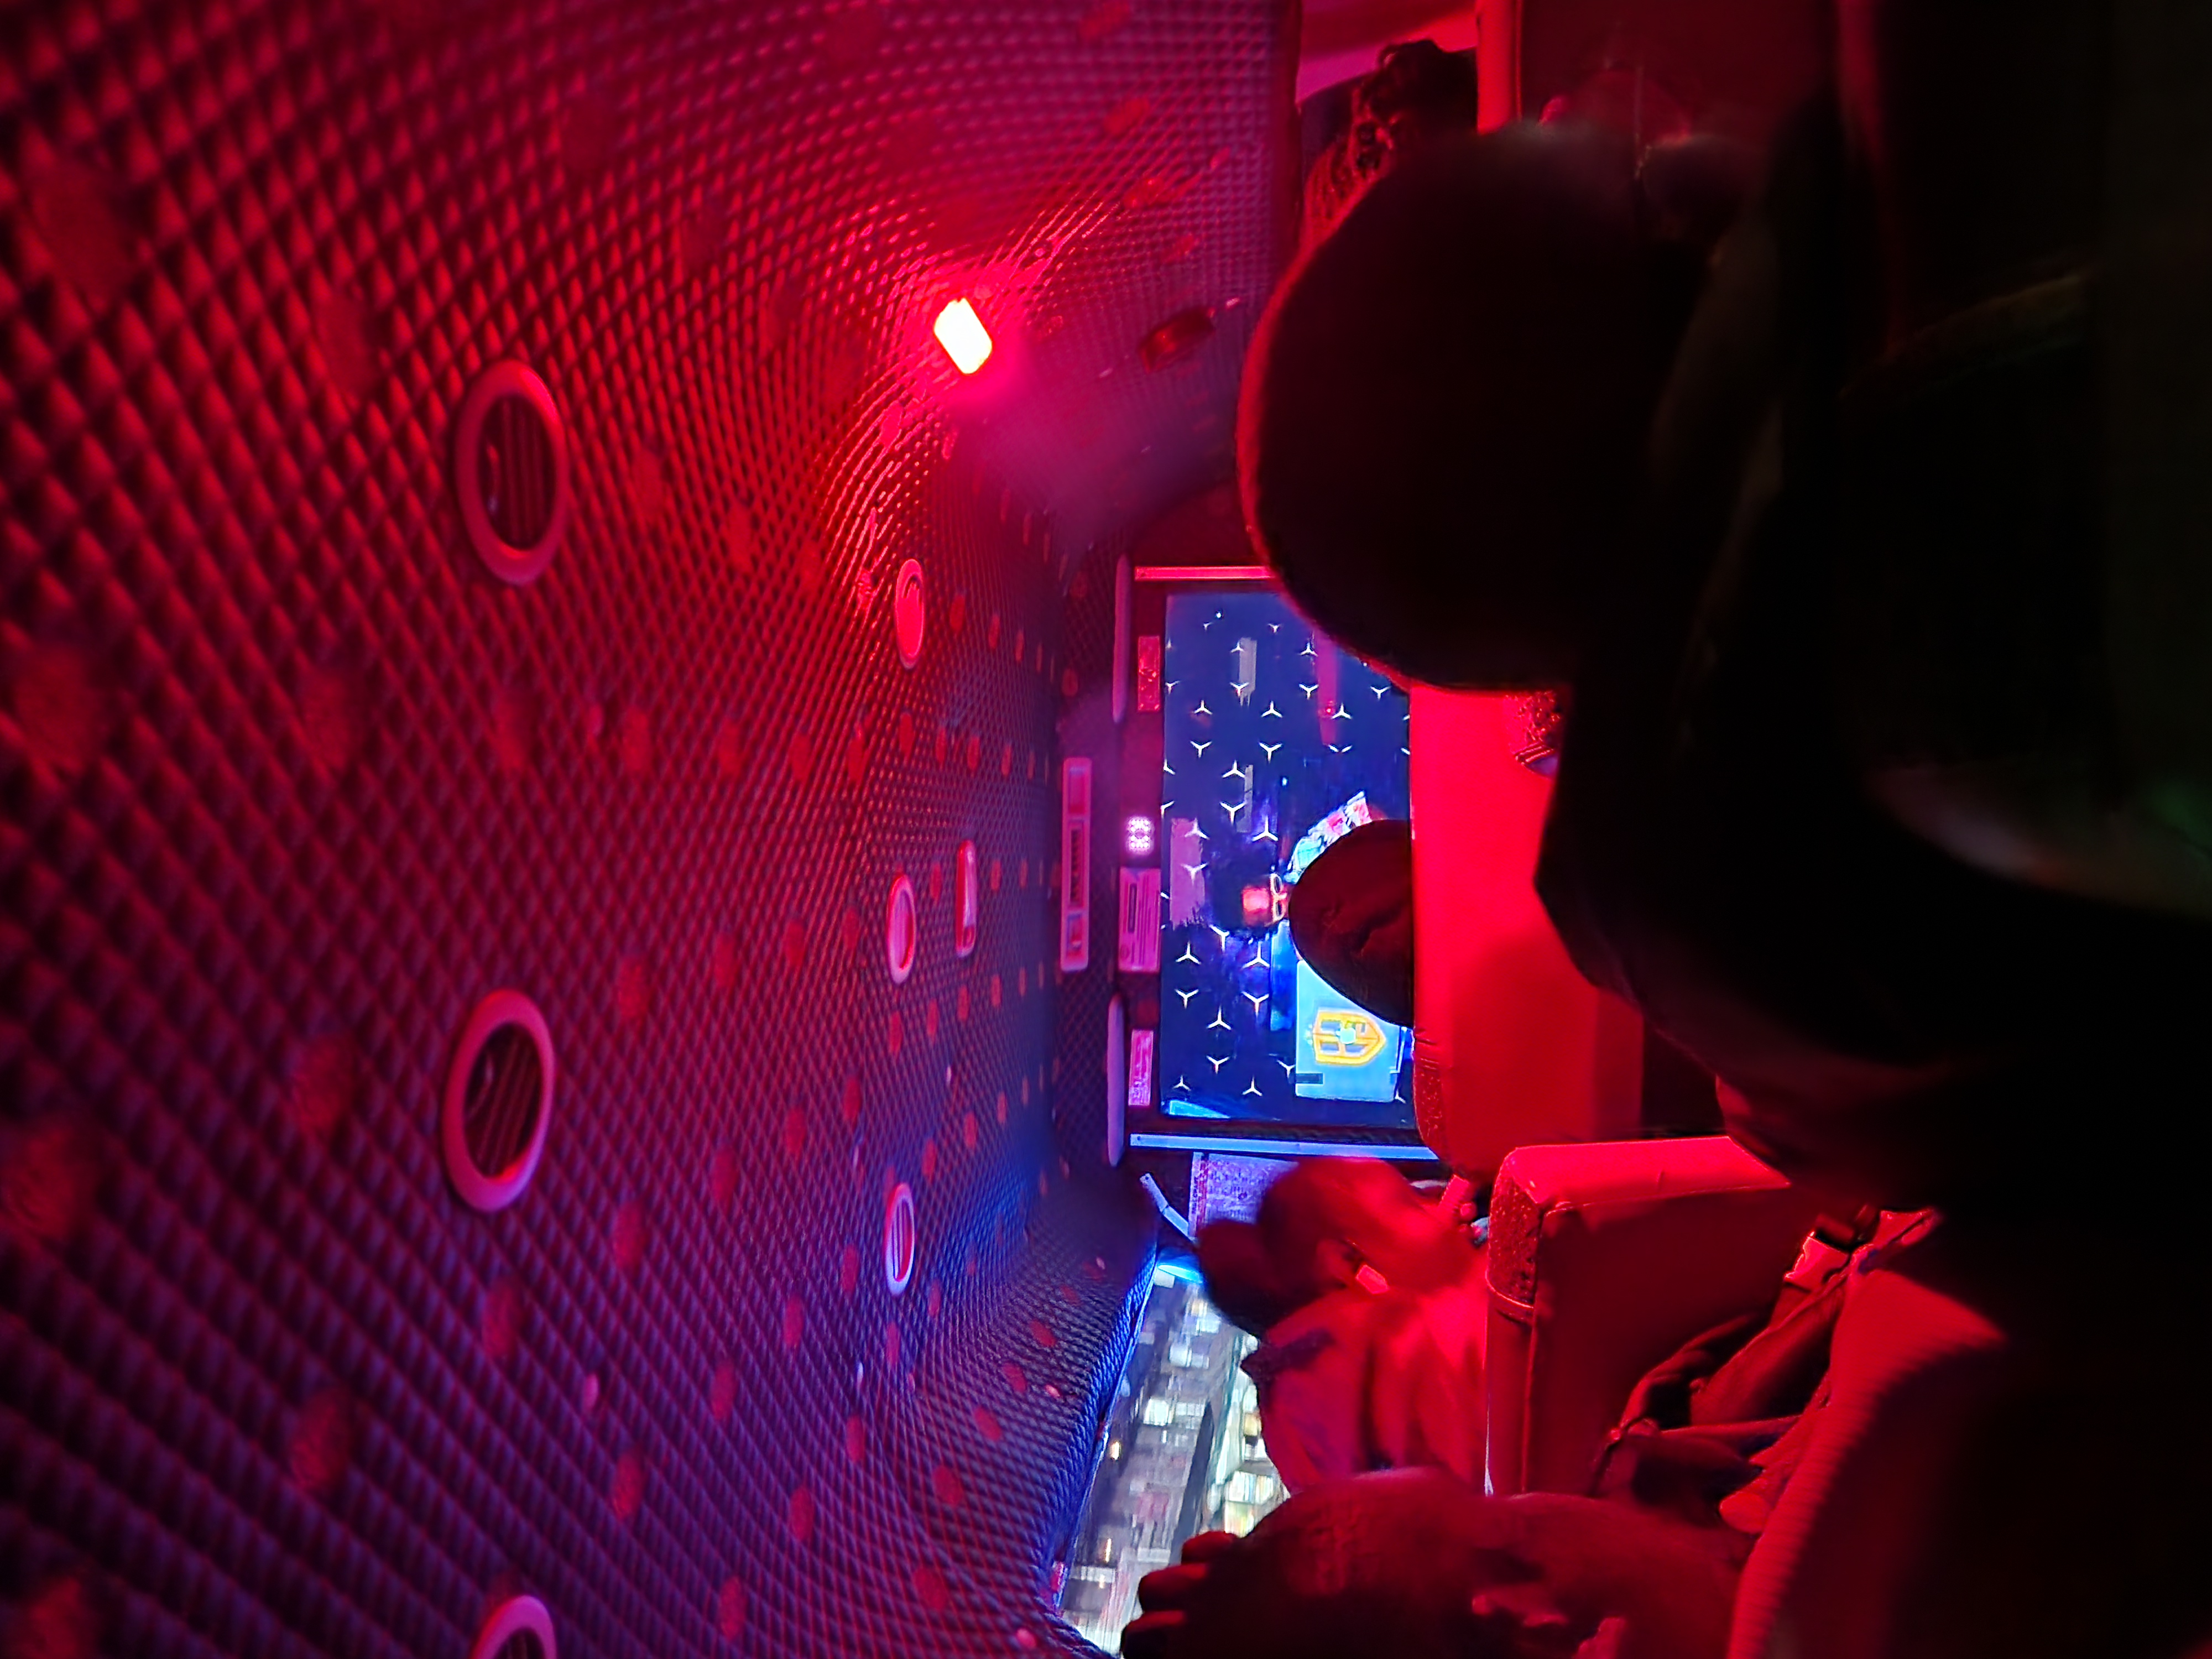
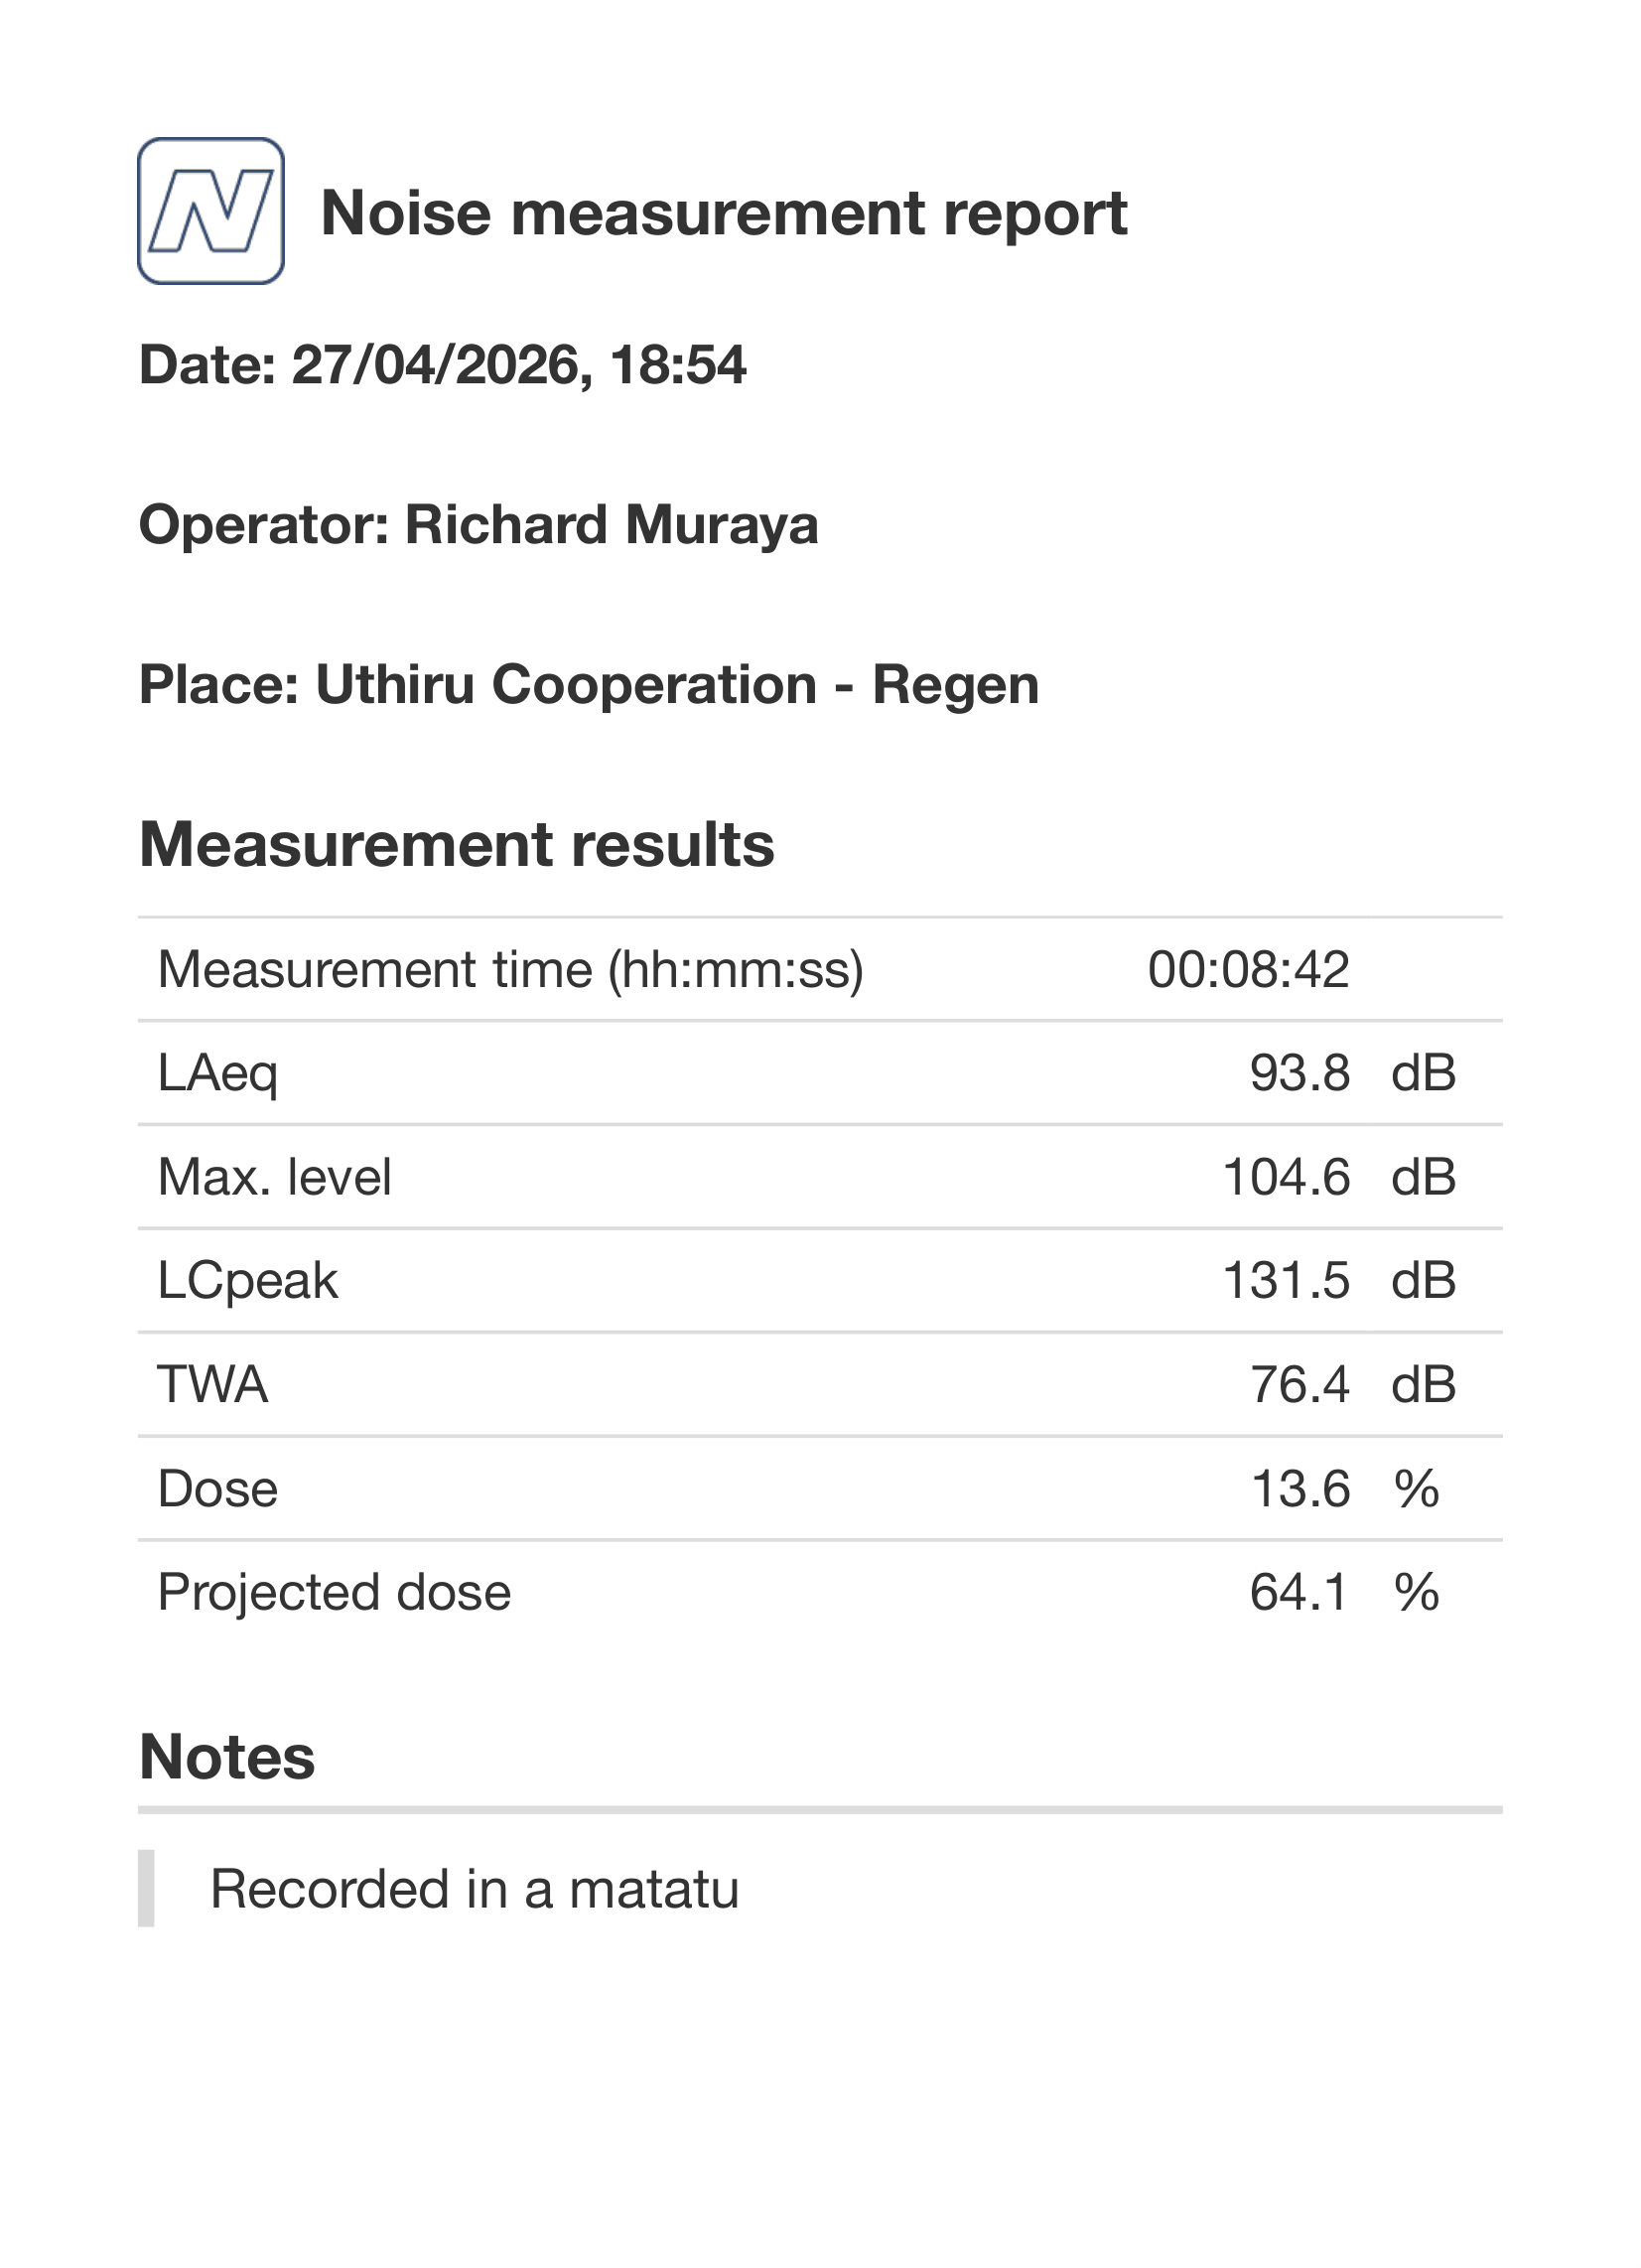
Matatus are the undisputed public transport vehicles along Kenya's roads. Renown for their colorful and trendy graffiti, these public service vehicles attract a youthful passenger clientele. On the evening of April 27th, a short noise measurement was conducted inside a matatu traveling along Waiyaki Way from Uthiru Cooperation in Nairobi County to Regen in Kiambu County. In just 8 minutes and 42 seconds, the data captured a striking picture of what many Nairobi commuters experience daily—but rarely quantify. This wasn’t a controlled lab test. It was real life: traffic, music, engine noise, and the unpredictable bursts that define public transport. We used the NIOSH (National Institute for Occupational Safety and Health) application installed on our iPhone 6 Plus smartphone to conduct the measurements during the 9 minute commute.
Quick Stats
- Duration: 00:08:42
- LPeak: 131.5 dB
- Average Noise (LAEq): 93.8 dB
- Maximum Level: 104.6 dB
- Peak Level (LCPeak): 131.5 dB
- TWA: 76.4 dB
- Noise Dose: 13.6%
- Projected Daily Dose: 64.1%
What Does the Data Tell?
Average Noise: An LAeq of 93.8 dB represents consistently loud conditions—well above the recommended safe exposure limit of 85 dB over an 8-hour period. At this level, sound energy isn’t just slightly higher—it’s several times more intense.
Maximum Level: The maximum level (104.6 dB) and especially the peak level (131.5 dB) reveal something more concerning: sudden bursts of extreme noise. These peaks likely come from: Horn blasts, abrupt acceleration and loud music system surges. While brief, these spikes place acute stress on the ear and can contribute to long-term damage when repeated.
Noise Dose: In under 9 minutes, this single trip used up 13.6% of the recommended daily noise exposure. If sustained, the projected dose reaches 64.1% over a full day. This means that just one or two similar matatu rides could push a commuter beyond safe daily noise limits.
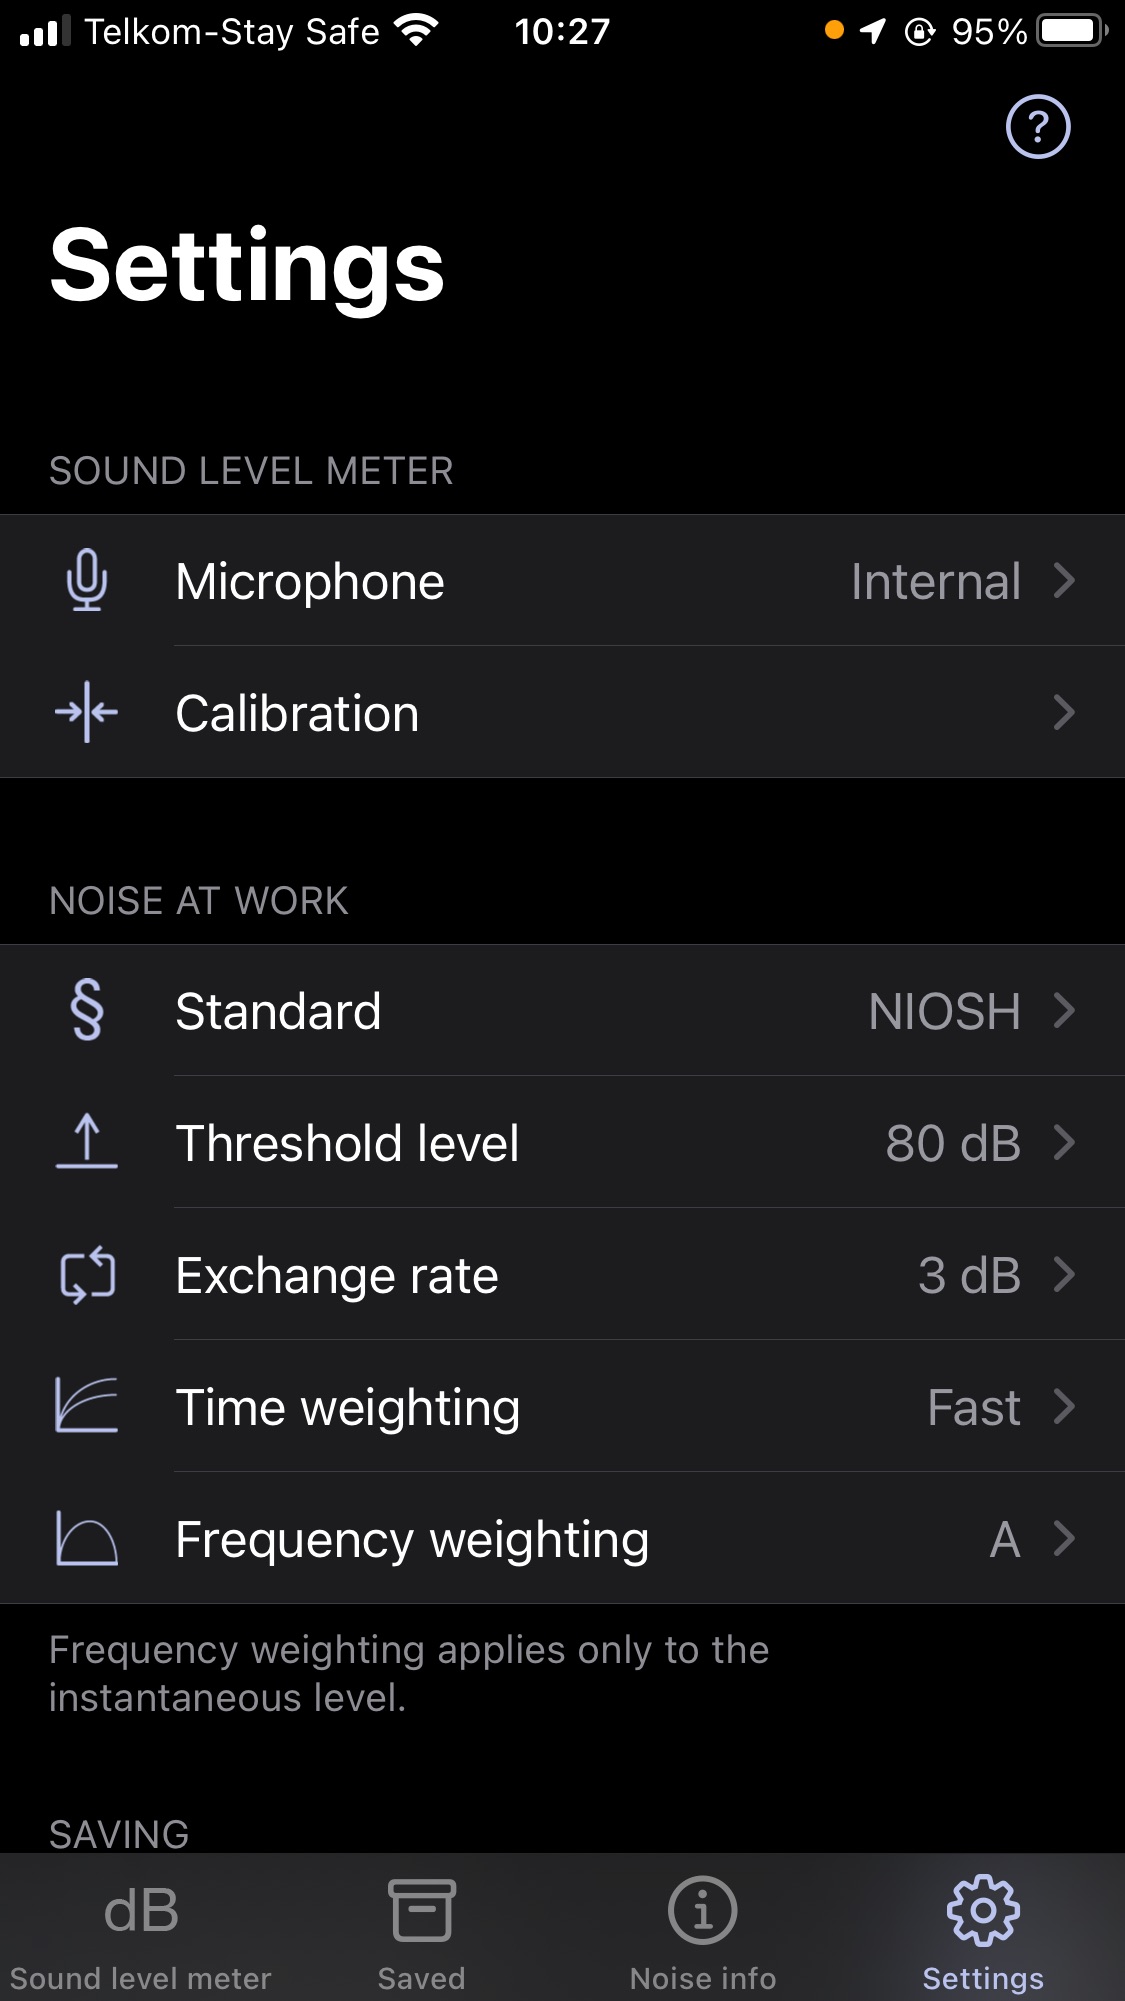
Methodology
Equipment & Tools
The devices deployed for the assessment includes a NIOSH (National Institute for Occupational Safety and Health) application version 1.4.2 (50) installed on an iPhone 6 Plus.
Data Collection Settings
The settings input into the NIOSH app were as follows:
Why This Matters
Over 2 million Nairobi residents use matatus for their daily commute with a majority boarding more than one matatu for each one-way commute. Matatu culture is characterized by loud music, colorful graffiti and general road indiscipline which results in faster yet risky commutes.
A 2014 study published on the International Health Journal indicated that about 70% of all passenger casualties involve matatus across the country. The author calculates that about 500 - 800 people die annually in matatu-related accidents, which thus account for 1 in every 6-9 road deaths involving matatus.
This puts the deaths per million matatu trips at 0.3 to 0.4 deaths per million matatu trips or 30-40 deaths per billion passenger kilometres. Latest comparative statistics from the World Health Organization put global passenger bus statistics at 0.2 - 0.5 deaths per billion passenger kilometres which makes matatus 60 - 150 times more dangerous than organized public bus systems globally.
However, these statistics don't highlight the attendant health risks including excessive particulate matter inhalation and excessive noise pollution exposure, that passengers are exposed to when commuting to and from home. This creates a crucial gap that citizen science & participatory research can fill through collection and publication of data to support policy development and implementation.
The Environmental Management and Coordination (Noise and Excessive Vibration Pollution) (Control) Regulations, 2009 enforced by the National Environment Management Authority (NEMA) explicitly limits the maximum noise from motor vehicles, including matatus/public transport vehicles at 84dBA when accelerating.
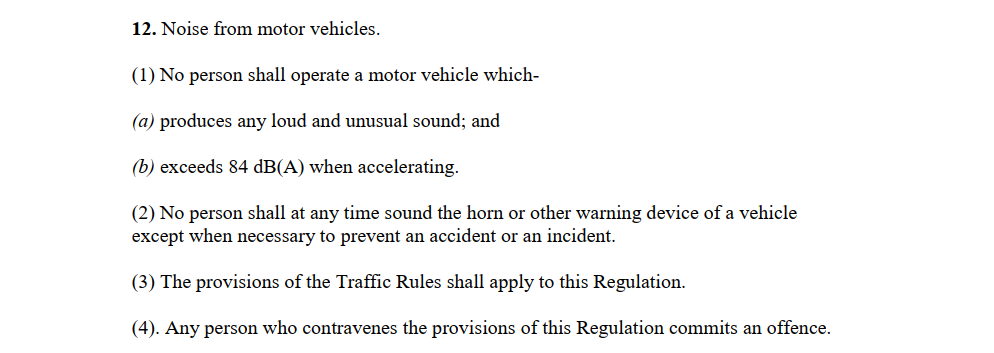
Back to our fieldwork data, the average noise recorded was 93.8 dBA compared to 60 dBA in the Regulations. At first glance, the 33 dB difference seems small, but remember that every +10 dB increase means a 10 times increase in sound energy since the decibel scale is logarithmic.
93 dBA carries ~9.5 times more acoustic energy than 84 dBA. The measured 93.8 dBA sounds roughly 2× louder than 84dBA. The matatu was therefore 2 times louder than the permissible limits.
Today, 29th April, is the 31st annual International Noise Awareness Day under the theme Protect Your Hearing, Protect Your Health. According to published research, living in noisy communities can increase the risk of elevated blood pressure, and that environmental noise is associated with an increased incidence of arterial hypertension, myocardial infarction, heart failure, and stroke. Additionally, studies have linked noise exposure with changes to digestion causing an upset stomach, ulcer, acid reflux and other ailments. The increased anxiety caused by loud noise exposure can also have a negative effect on digestive systems. However, the most dangerous negative effects of noise pollution is the increased susceptibility to mental health & cognitive issues including Alzheimer’s disease and other dementias.
References
To learn more about the NIOSH Sound Level Meter App, click the following link: https://www.cdc.gov/niosh/noise/about/app.html
Why we chose to use the NIOSH Sound Level Meter App: https://www.cdc.gov/niosh/bulletin/2014/sound-app.html
The raw data export from the NIOSH Sound Level Meter App:
About the Author
Richard Muraya
Author
Reactions
Welcome to The Demography Project community! Please keep conversations courteous, constructive, and on-topic. To foster a respectful and inclusive environment, comments may be reviewed by our Community Team, who will be identified by a "Staff" label. We ask that you engage in good faith, avoid personal attacks, and respect the privacy and dignity of all participants. Content that is hateful, misleading, spammy, or in violation of our community standards may be removed without notice, and repeat offenders may lose commenting privileges. See our community guidelines for more information.
No comments yet. Be the first to share your thoughts!